


Essential Lens: Analyzing Photographs Across the Curriculum
Garbage: The Science and Problem of What We Throw Away
Introduction
Each person in the United States generates five or more pounds (2.3 kilograms) of waste a day: about the weight of a medium bag of sugar. More than half of that garbage is buried and stored in landfills. Increasingly, however, cities are promoting recycling programs, often getting schools involved so students can learn about recycling and follow these practices at home.

#4020
Photographer: unknown
Source: NOAA
A person in a Scandinavian country (such as Sweden, Denmark, or Norway) generates about the same amount of waste as an American. People in developing countries generate less waste than Americans or Europeans; for example, a person in India generates about three-fourths of a pound (0.34 kilograms) per day. Still, every country must find a way to process the garbage that each of its residents generates every day, month, and year.
In this photo series, students will consider what happens to items that they and everyone else on the planet throw away. They will think like engineers, defining a problem by categorizing and quantifying components of trash, and considering different solutions to the problem of dealing with rubbish. The photos will give students a starting point for weighing the pros and cons of recycling, composting, landfills, and other current ways to get rid of garbage. (For reusing garbage, see the Reusing Garbage: Art Projects in References and Further Reading.)
As you analyze the photographs in this collection, keep in mind—and prompt your students to think about—the source, context, scale, vantage point of the photographer, color, or texture, etc. (See the Glossary for more about scale, vantage point, and texture.)
Note: Trash, garbage, waste, and rubbish are used interchangeably here. Experts usually use “trash” to mean discarded dry items, “garbage” to mean wet items, and “waste” or “rubbish” as a general, inclusive term for all discards.
Curriculum Snapshot
- What happens to our waste
- Composting and the carbon cycle
Key Learning Targets
Students will:
- Use photographs to investigate the impact to the Earth of human activity that generates waste.
- Use photographs to explore potential engineering solutions to waste production and discuss their advantages and disadvantages. (More information is available within each activity.)
Essential Questions
These big ideas or essential questions organize the content and topics. Exploring how we define garbage and what we do with it through this collection of photographs will allow students to consider the following questions:
- What happens to items we throw away?
- How can we improve our waste-processing systems?
Prerequisite Knowledge
Before viewing the photos and doing the activities, students should:
- Be able to calculate percentages. (Optional: make charts such as pie charts and flow charts.)
- Be familiar with or introduced to Earth and space science principles (for example, use of Earth’s resources and the human impact on Earth).
- Be familiar with or introduced to life sciences concepts about matter and energy cycles such as the carbon cycle.
- Understand how science and engineering are similar and different.
Standards
These lessons and activities are in accordance with Disciplinary Core Ideas: Earth and Space Sciences ESS3, Earth and Human Activity; and Life Sciences, LS2 Cycles of Matter and Energy in Transfer in Ecosystems from the 2012 Framework for K-12 Science Education from the National Research Council of the National Academy of Science.
Also consistent with the Framework, students should be ready to apply crosscutting concepts of cause and effect, energy and matter flows, and systems and system models.
References and Further Readings
NOAA and Ocean Conservancy marine debris cleanup programs
http://marinedebrisblog.wordpress.com/category/waste-management
Ocean Conservancy: International Coastal Cleanup Top 10 Items Found
http://www.oceanconservancy.org/our-work/international-coastal-cleanup/top-10-items-found-1.html
Columbia University state-by-state waste disposal map
http://www.seas.columbia.edu/earth/recycle
Environmental Protection Agency: City Waste in the United States
http://www.epa.gov/epawaste/nonhaz/municipal/index.htm
MIT Trash Track
http://senseable.mit.edu/trashtrack/index.php
Washington State University and Snohomish County Extension: Compost Outreach Project
http://snohomish.wsu.edu/compost
Washington State University, “Compost: Closing the loop on urban garbage and local farms”
http://news.wsu.edu/2013/11/12/compost-closing-the-loop-on-urban-garbage-and-local-farms/#.UthsVvRDujE
Slate articles on costs of green alternatives:
“Reusable mug vs. disposable styrofoam cup”
http://www.slate.com/articles/health_and_science/the_green_lantern/2008/09/grande_americano_extra_green.html
“Glass, plastic or paper milk containers”
http://www.slate.com/articles/health_and_science/the_green_lantern/2011/03/disoriented_in_the_dairy_aisle.html
David Suzuki on incineration
http://www.davidsuzuki.org/blogs/science-matters/2013/09/incinerating-trash-is-a-waste-of-resources
Incineration site example
http://www.co.marion.or.us/PW/ES/disposal/mcwef.htm
Flowcharts and process diagrams
http://en.wikipedia.org/wiki/Flowchart
http://en.wikipedia.org/wiki/Process_Diagram
Framework for Science Education
A Framework for K-12 Science Education. Practices, Crosscutting Concepts, and Core Ideas.
http://www.nap.edu/catalog.php?record_id=13165
Biomimicry Institute
http://www.asknature.org
http://biomimicry.net
Social Studies References
Environmental Protection Agency: Recommendations and Actions. “EPA09: Establish a Blueprint for Environmental Justice Throughout EPA’s Operations.”
http://govinfo.library.unt.edu/npr/library/reports/EPA9.html
Massey, Rachel. Environmental Justice: Income, Race, and Health. Medford, MA: Tufts University, 2004.
http://www.ase.tufts.edu/gdae/education_materials/modules/Environmental_Justice.pdf
Additional Activities and Books
NatureBridge, “My Garbology” project
http://www.naturebridge.org/garbology.php
Hume, Edward. Garbology: Our Dirty Love Affair with Trash. New York: Penguin Group, 2012.
Rathje, William L. and Cullen Murphy. Rubbish! The Archaeology of Garbage. University of Arizona Press. 2001. Originally published New York: Harper Collins, 1992.
(see also project summary at http://humanitieslab.stanford.edu/23/174)
Reusing Garbage: Art Projects
Chris Jordan
http://www.chrisjordan.com/gallery/intolerable
http://www.chrisjordan.com/gallery/katrina/#reddoor
http://www.chrisjordan.com/gallery/midway/#CF000313%2018×24
Vik Muniz
http://www.wastelandmovie.com/
San Francisco Recology program
http://www.recology.com/index.php/recology-art
Sandra Schimmel
http://Schimmelart.com/index.htm
El Anatsui
http://www.pbs.org/art21/artists/el-anatsui
Repurposed goods
Upcycled Products
http://alchemygoods.com
Sara Bella Upcycled: Recycling plastic bags into art
http://www.sarabella.com
Videos
Compost Outreach Project (Washington State University and Snohomish County Extension
Using the scientific method (controls and measurements) to test compost for agriculture
http://www.youtube.com/watch?v=XMx0-8pKHkI
Challenges to using compost for agriculture
http://www.youtube.com/watch?v=LAYRIiD1VVw
NASA video on the carbon cycle and climate change
http://www.pearyms.org/apps/video/watch.jsp?v=15738
Story of Stuff videos
http://storyofstuff.org/
Activating Students’ Prior Knowledge
Middle & High School
Earth and Space Science, Engineering, Life Science, Social Studies

#4043
Photographer: unknown
Source: Shutterstock
If time permits, have students observe, write down, and possibly photograph all the garbage they or their family generate in a day or a few days. In pairs or small groups, have students compare these waste logs. Ask them to consider how much waste a person or family in their community generates and what kinds of materials are in that waste. A less time-consuming alternative is to ask students in pairs or small groups to list six items their families threw away recently: three that were typical waste and three that were unusual.
Tell the students that archaeologists, who study human history by looking at items humans have left behind, learn much about the daily life of ancient civilizations from their garbage, such as what they were eating, where they gathered their food, or where they hunted. Ask students to review their waste logs or lists, and then discuss what an archaeologist would learn about them from studying their garbage.
Emphasize that at this point, no answers are right or wrong.
What Happens to What We Throw Away?
Middle & High School
Earth and Space Science, Engineering, Life Science, Social Studies
Background
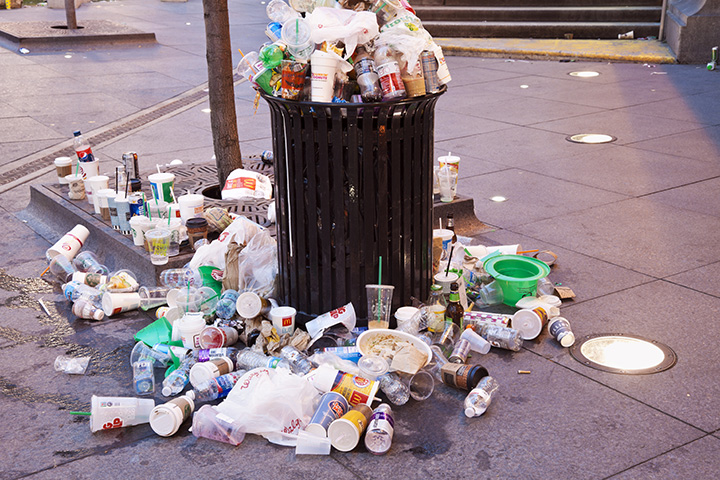
Garbage is complex. Even when citizens make an effort to sort their waste into glass, paper, recyclable plastic, and food, many items are hard to classify or contain a mixture of materials. Some items will always escape the collection system and end up where they can be harmful, such as parks, roadsides, or the ocean.
LEARNING TARGETS
- I can describe types of waste and what happens to them in my community.
- I can discuss pros and cons of different ways of dealing with garbage, such as landfilling, recycling, and composting.
- I can collect data and present it in percentages (and if appropriate, in graphs and tables).
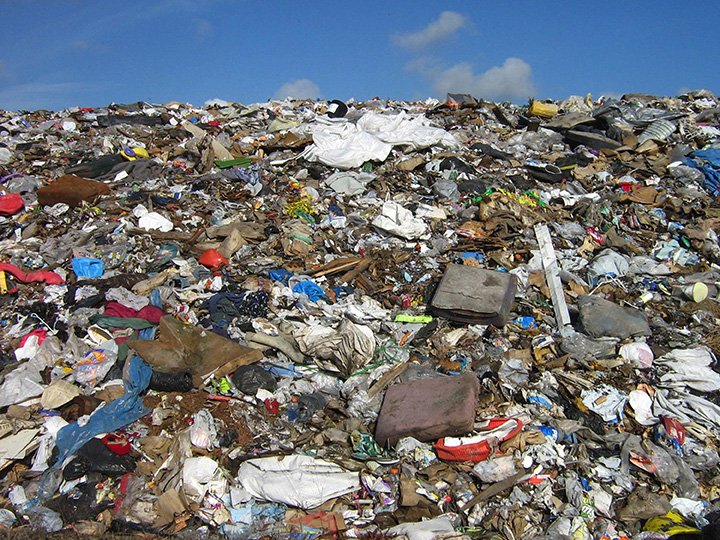
A majority of waste in the United States is sent to landfills to be buried, and for items that do not break down over time, stored. The United Kingdom, Spain, and Portugal also send about 50 percent or more of their trash to landfills. In Northern Europe, 30 to 50 percent of rubbish is burned in modern incinerators that trap pollutants and use the energy for heat and electricity. Some U.S. waste is also burned: in 2011, according to the U.S. Environmental Protection Agency (EPA), 25 states had facilities to burn waste for energy. (Use the Columbia University Waste map to see your state. See link in References and Further Reading.) Also according to the EPA, in the United States in 2011, about 35 percent of the 250 million tons of garbage generated in a single year was recycled and composted. This activity focuses on garbage that is destined for landfills, recycling, or composting.

#4015
Photographer: unknown
Source: iStock
Note: When discussing this topic with students, best practices in environmental education advise sharing information only, not imposing values. For this topic, pointing out the value of reusing, recycling, or composting could be balanced with discussions or assignments about the costs of transporting and processing reused, recycled, or composted materials, or about the difficulties of recycling in a city that does not have a widespread recycling program.
The photographs in this exercise show typical American garbage; however, landfills around the world generally look the same.
Begin the Activity
Materials:
- Photos printed large enough to identify individual waste items
- Information on school or community recycling, reusing, and composting policies
- Rulers, pencils, graph paper
Review the categories of items that the school or the community recycles, reuses, or composts. In pairs or small groups, give students handouts of the photos that are large enough to identify and count individual items. Ask students to categorize and count items that they think might be recycled, reused, or composted. Have them describe why they think the item could be removed from potential landfilling and why. For mixed-material items, ask what processing or disassembling might be needed.
Based on counts from the photographs generated in the pairs or small groups, have students estimate or calculate the percentage of garbage from the collections in the photographs that might be recycled, reused, or composted. If time permits, data from the entire class could be combined for an estimate or calculation from all photographs.
Optional: Depending on the data-organizing and data-presenting methods that your class has been learning, students might make T-charts, bar graphs, or tables of their waste counts. If they have learned percentages and pie charts, they might categorize the waste items they see in the photographs into the same categories as those designated in figure 3 on the EPA Municipal Solid Waste website (http://www.epa.gov/epawaste/nonhaz/municipal/index.htm). Students can convert category counts into percentage of total garbage, and put the results into a pie chart for comparison with the EPA chart. In any case, remind students to label the entire graph and, if appropriate, divide and mark the X and Y axes and label divisions, categories, and axes. For numerical divisions, start axes at zero. For all tables or charts, provide a title and legend if needed.

#4045
Photographer: unknown
Source: Department of Public Works, Cowlitz County, Washington
Encourage students to be objective. They should categorize and count items without judging what should have been done with them. Note that they must make decisions about what categories to make and how to define the categories (e.g., what counts as plastic, paper, etc.). Remind them that this is what scientists do when they plan experiments and collect data. Tell them to write down their methods: how they defined different types of waste—for example, by identifying particular colors, shapes, or textures; how they resolved unclear items; whether they counted the entire collection in the photograph or counted a representative sample area; and so on. Have them convert category counts into percent of the total waste counted to make comparisons easier.
Ask students to share their results, describing the decisions they made and why they made them; what items were particularly difficult and how they decided to categorize challenging items; and their interpretations about the amount of garbage that might be reused, recycled, or composted. Ask which results were expected and why, and which results were surprising and why.
Questions to Consider
Q: Compare your results to the EPA estimates of percent of waste in different categories. Do the photographs and your results confirm or contradict EPA estimates of categories of waste? (Option: use local numbers if available.) If results are different among student groups or compared to local or national numbers, what are some possible reasons?
A: Answers will depend on students’ results. See the EPA site in References and Further Reading and local resources for comparisons. For differences in results, have students look at the methods they wrote. They might name sample size, sample representativeness, and decisions about what to include in each category.
Q: Does the source of the photo (researcher, news media, blog post, etc.) affect your opinion about whether the photographs were manipulated or staged? Does the photograph present a particular point of view that makes the waste appear a certain way?
A: Photo sources are in the photo captions.
Q: Can you think of any applications for your data? (For example, if you analyzed your school’s waste, how might the school use the data? Why might the city or the EPA be interested in this kind of data?) What features of your data do you think are the most convincing? (Which calculations or estimates do you have the most confidence in and why?)
A: A school, community, or country might be interested in knowing if it is meeting recycling goals or what types of items are being thrown away. It might use this data to evaluate its recycling and composting policies and make decisions about whether to focus waste-management resources on landfills, recycling, combustion facilities, or other methods.
Q: If your results were different from other groups, what features of your group’s data collection methods might have led to the differences?
A: Students might have had different photos, with garbage collected from different places. Groups might have defined plastics, paper, and so on more broadly or narrowly. They might have made different decisions about mixed-material items or other items that were difficult to categorize. They might have used different methods to identify difficult-to-categorize items (for example by color or shape). Groups might have decided to count the entire photo or a section.
Q: What are some advantages and disadvantages of reusing, recycling, and composting compared to: 1) sending waste to a landfill? 2) burning waste for energy?
A: Students might think of the costs in machines and employee time of sorting items for recycling. They might think of transport costs. In 2010, according to Edward Hume’s book Garbology, our two highest exports to China, by volume, were waste paper and scrap metal shipped to the country for recycling. The MIT Trash Track project used cell phone technology to monitor individual discarded items. It found that hazardous waste items such as electronics traveled more than 1500 kilometers (900 miles) on average to get to specialized recycling facilities. One printer cartridge traveled more than 6000 kilometers (3800 miles). Students might also think of the water, chemicals, and energy used to process recycled and reused items. The Slate articles in the References and Further Reading section give some considerations.
Processing Waste
Middle & High School
Earth and Space Science, Engineering, Life Science, Social Studies
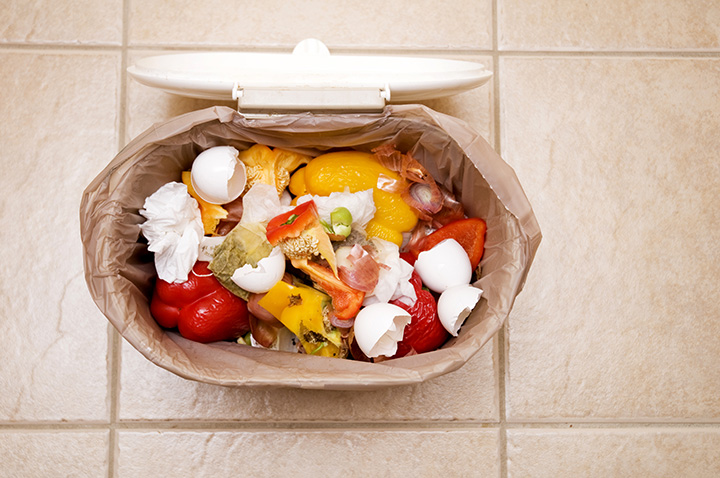
Part 1
Ask students to meet in pairs or small groups and estimate how much of their own garbage is food. (Option: estimate the proportion of their family’s or the school’s garbage instead.) Ask them to explain their estimates, and describe what they think happens to food that is buried in landfills and what alternatives we might have to sending food to landfills. Depending on programs available in their community, they might think of composting or sending unused restaurant or cafeteria food to community food banks, shelters, and soup kitchens.
Optional: For one day, have students collect the food waste they generate (no liquids and no packaging, just solid food) in doubled zip-top bags or a reusable container. Have them bring the food to class, weigh the food they discard in one day, and extrapolate to estimate how much food they throw away in a year. (Tare the scales with the empty container.)
LEARNING TARGETS
- I can describe the carbon cycle, starting from waste organic materials to agriculture to food to waste.
- I can describe biodegradation in terms of microbial activity.
- I can describe why some things, such as food, are expected to be degraded quickly by microbes and why some things, such as metal or plastic, are not, and then connect these ideas to the carbon cycle.
- I can describe how aspects as scale and depth are used to identify and categorize data. (See the Glossary for more about scale and depth.)
Emphasize that, at this point, no answers are right or wrong, and the point of the exercise is simply observation. (Just for comparison, the EPA estimates that about 15 percent of solid waste is food. See the EPA link in References and Further Reading.)
Note that this section uses the chemist’s definition of organic: complex carbon-containing molecules, usually proteins, nucleic acids, lipids, and carbohydrates that are produced by living organisms. Tell students that chemists and biologists define the word organic differently from the grocery store definition of organic as farmed under specific conditions.
Part 2
When we throw away organic materials such as food and untreated paper, we assume they will biodegrade when buried. Biodegradation means that bacteria, yeast, and other single-celled and simple multicelled microbes use food and untreated paper as an energy and carbon source in metabolism (specifically catabolism). In fact, this microbial activity degrades enough organic material in landfills to produce potentially dangerous amounts of explosive methane gas. At many landfills, this methane gas is captured and used as an energy source.

#4053
Photographer: unknown
Source: Shutterstock
Biodegradation describes one part of the carbon cycle. In the carbon cycle, carbon atoms go from being part of complex organic molecules—such as proteins, fats, nucleic acids, and carbohydrates—to being part of simple compounds such as methane gas (CH4) and carbon dioxide gas (CO2). (Both are greenhouse gases that trap heat on Earth when they build up in the atmosphere.) Methane can be converted to CO2. For example, when methane is burned, it produces CO2 and H2O (CH4 + 2O2 = CO2 + 2H2O). CO2 is captured by photosynthetic organisms such as plants and algae and used to produce complex organic molecules.
The carbon cycle relies on microbes having the right enzymes to break down the carbon-containing organic molecules. Many microbes produce the enzymes to break down plant and animal components. Even though plastics are mainly composed of complex carbon-containing molecules, however, few microbes have the enzymes to begin breaking them down.
The organic molecules of our food should be biodegradable. However, archaeological work at modern landfills (see Rathje in References and Further Reading) found that 40 percent or more of landfill space is occupied by food, paper, and other materials that we think of as biodegradable, but that are not decomposing. Biodegradation by microbes requires particular conditions, such as pH, temperature, and availability of water and air. Compacted waste in a landfill might not meet these conditions. The Rathje Garbage Project found newspapers whose dates were still readable 40 years after burial, and lettuce, carrots, and guacamole that were recognizable decades after it was discarded.
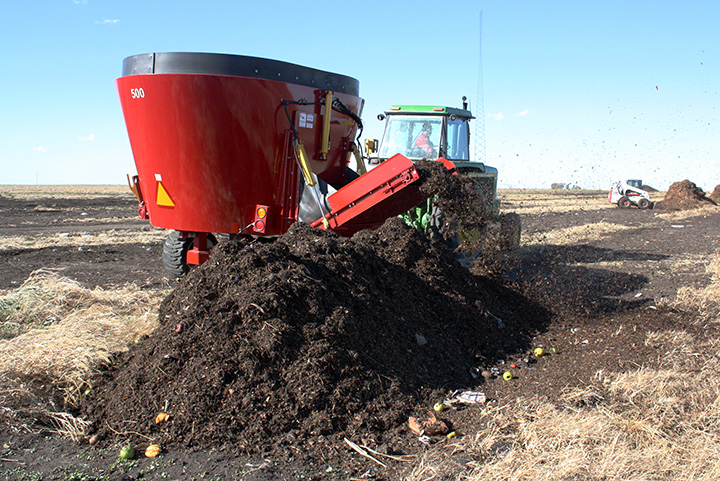
Biodegradation is not a simple matter of burying food or other organic materials and expecting them to disappear. Composting—the process of encouraging microbial growth to break down organic material such as food and yard waste—requires planning, monitoring, and adjusting. Anyone who has tried composting in their own garden knows that getting proper biodegradation requires controlling the pH, temperature, and access to air, among other factors. Composting on a large scale—for example, with an entire city’s worth of food and yard waste—requires trained engineers. Like scientists, engineers understand the natural world and the laws of physics. The work of engineers tends to be more applied, finding ways to design processes to solve human problems. In addition, designing an effective composting system requires life science expertise, because composting is an example of biomimicry. Biomimicry uses biological processes as the basis for designing sustainable systems.
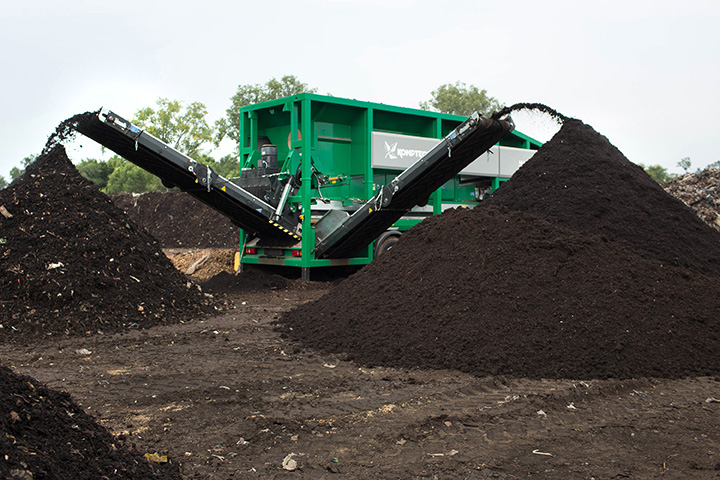
In this photo collection and related activity, students will see what large-scale composting looks like, and consider the steps and the space, equipment, and expertise that a statewide composting project requires. Note that the photos do not show a single batch of compost or a single crop, but are a composite to show the entire process. Photo credits are in photo captions; this activity was inspired by work by the Washington State University Compost Outreach program. Information and videos are in References and Further Reading.
Begin the Activity
Materials:
- Photos on manageable handouts (post-it note size or larger)
- Rulers, pencils, graph paper
In pairs or small groups, give students a set of photo handouts. Have students think about and describe what each photo shows and, if applicable, what is happening in each photo. Descriptions should include information on several levels, depending on the photo: where the items might be found or where the process is taking place; what is happening at the mechanical level; and what is happening at the biological, microbial, and chemical level. Have students put the photos into a cycle, in the order in which the items or processes they show occur.
Optional: Have students create a flow chart or process diagram (see links in References and Further Reading ) of the composting process. They might indicate the form of carbon at various steps (for example, complex organic molecules, such as proteins, nucleic acids, fats, and carbohydrates in food; amino acids, nucleotides, smaller lipids and sugars, as well as gases such as methane and carbon dioxide during biodegradation and uptake into plants; and back to complex molecules in plants).
Guide to photos: Student answers will depend on how much they have learned about chemistry, microbiology, photosynthesis, and the carbon cycle. Generally, the photos should be put into the following cycle with at least some of the following descriptive elements.

#4044
Photographer: unknown
Source: Office of Sustainability, Illinois State University
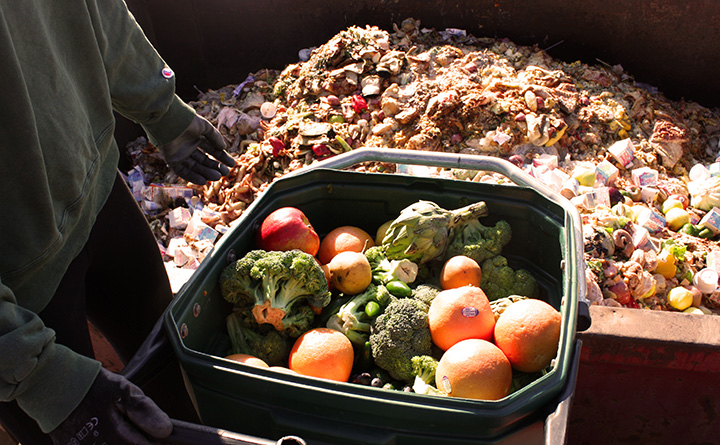
- 4053 and 4042, labeled as “the collection of food waste from homes, restaurants, and stores”: The content is complex organic food molecules with some microbial biodegradation occurring.
- 4034 and 4044, labeled as “food waste at composting processing plant being mechanically or broken down so microbes have more surfaces to attach to so they can begin biodegradation”: The content is complex organic being microbially degraded into smaller versions; for example, from long chains of sugars (complex carbohydrates) to smaller chains.
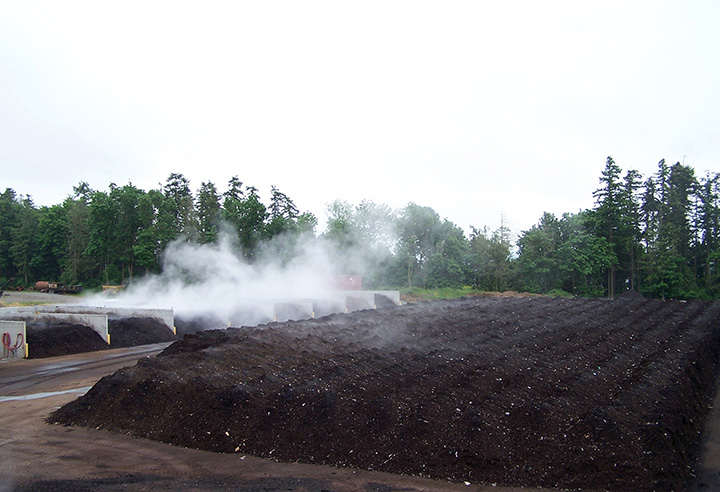
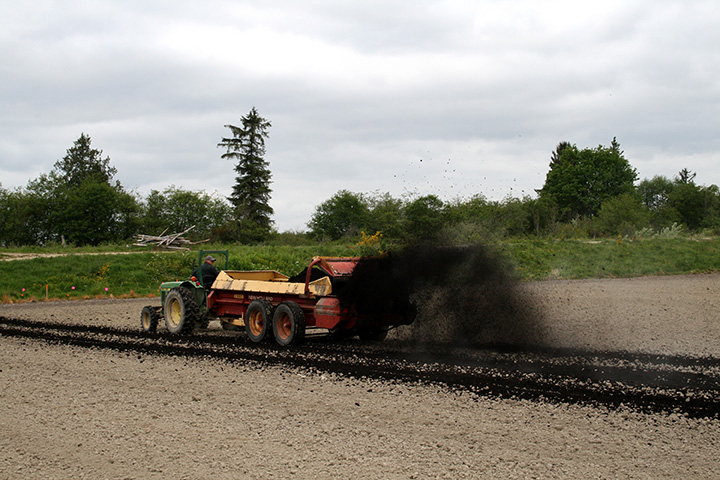
- 4037 and 4023, labeled as “the ground food waste, now compost, being left in piles for biodegradation with grinding (above) and transportation introducing air to help microbial growth”: The content is complex molecules being degraded into simple compounds with extensive microbial growth, creating enough heat to create steam from the compost (gases produced by biodegradation are not visible).
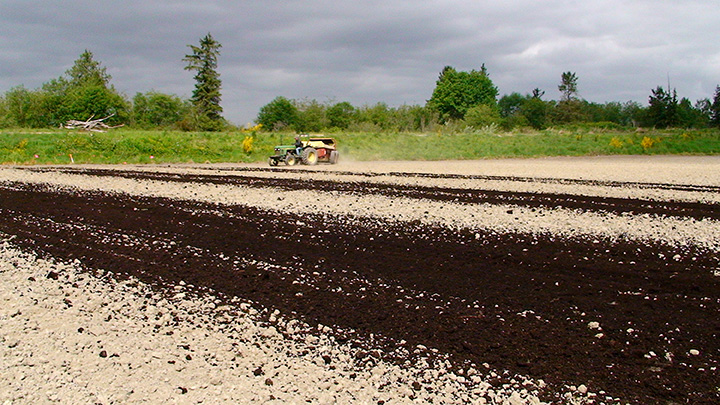
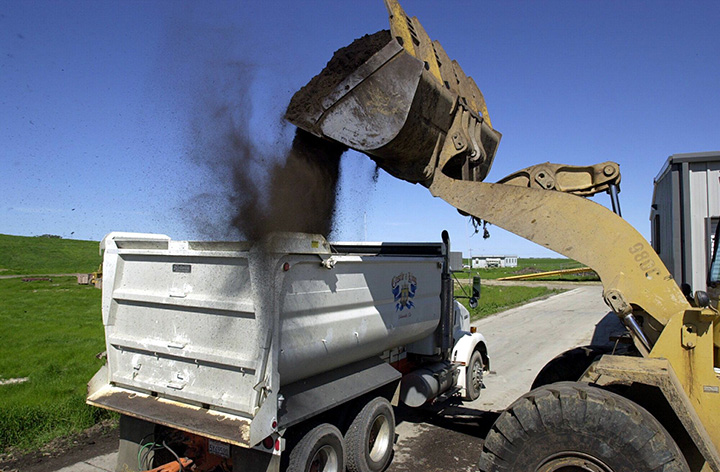
- 4036 and 4040, labeled as “compost being collected and transported to farms”: The content is simple compounds that can be taken up by plants.
- Students might add a final arrow to make a cycle indicating that harvested plants are the source of the food waste in the first photos.

#4026
Photographer: Andrew Corbin
Source: WSU Compost Outreach Project, Washington State University, Snohomish County Extension
Questions to Consider
Q: Why is compost—the product of the composting process—a good fertilizer for plants?
A: The compost contains small organic molecules that plants need, such as amino acids, nucleotides, and simple sugars. These molecules are produced when microbes degrade larger organic molecules into components that are small enough to be taken up by the plants. Compost might also contain other nutrients that plants need in small amounts, such as minerals.
Q: What are some potential disadvantages to citywide or statewide composting programs?
A: As with the first activity, students might discuss processing and transporting costs and time, and the space required to process the compost. They might discuss the difficulty of composting without an organized community composting program. The 10-minute video on composting challenges (see References and Further Reading) describes problems farmers have encountered, including cost, the need to engineer ways to spread the compost, and plastics that get into compost.
Where Does Our Garbage Go? Costs of Throwing It Away
Middle & High School
Earth and Space Science, Engineering, Life Science, Social Studies
Background
Oftentimes when considering where to locate elements of a community that are perceived to have a negative impact on the people, the phrase “not in my backyard” is used. Consider that people do not want such things as a jail, airport, power-generating plant, or cell phone tower near where they live. There are a variety of reasons for this, such as excessive noise, aesthetics, or potential health risks. While an airport, jail, etc., may provide jobs, the overall impact on a community can be seen as negative. Generally speaking, operations such as these are thought to be better situated away from communities. Garbage disposal is similar in that communities prefer landfills, composting operations, sewage treatment facilities, or other types of waste management facilities to be located outside of the city. With city boundaries connecting with other cities, however, moving garbage out of one city may mean moving it into another one.
LEARNING TARGETS
- I can describe how garbage disposal requires people to make decisions and the consequences associated with these decisions.
- I can explain how garbage disposal has real and hidden costs that have long-term impacts on the environment and on people and living organisms.

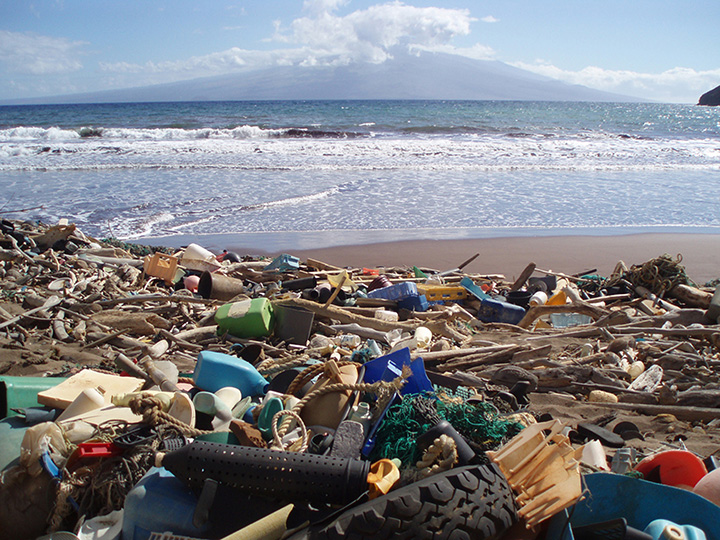
#4050
Photographer: Andy Collins
Source: NOAA Office of National Marine Sanctuaries
The process of deciding where garbage dumps, landfill sites, processing plants, and so on should be located is based on a list of criteria, including geography, accessibility to roads and power, and technology. Additional factors are at play, too, such as local and national stakeholders, and policymakers. For example, dry climates with minimal water flow are helpful locations for landfills. However, not all garbage can be shipped to deserts and arid land. Garbage sites need to be closer to population centers for convenience. Often, they end up near areas of higher poverty or fewer resources. The reason for this likely stems back to the idea of “not in my backyard,” in that people with the most political or economical clout may be able to affect the selection of garbage dumps; those with less influence may not. Couple this with the idea that garbage sites provide jobs and economic benefit to an area. Communities needing economic stimulus may be more inclined to have a waste site nearby. This is the case in the United States, as well as in most cities and countries around the world [1].
Today, with recycling, composting, and reusing, we are able to greatly reduce the amount of garbage we produce. People still produce waste, however, and that waste needs to be put somewhere.
Begin the Activity
Ask the students to think about the garbage the custodian will take out of their classroom at the end of the day. Where will that garbage end up in the future? Some garbage may be recycled, some placed in a landfill, some incinerated, etc.
Have students work in teams to research and discuss what happens to the garbage in their own community. Is it in a landfill near their town, or perhaps in a different state? Once they identify where their waste goes, have them think about the sequence of where the garbage goes after it leaves their room or home. For example, it first goes into a dumpster, the dumpster is picked up and dumped into a larger garbage truck, then taken to a transfer station, and so on.
Read the following fact from the Environmental Protection Agency:
“Americans generate about 251 million tons of garbage per year. This breaks down to be about 4.38 pounds per person each day.” [2]
Once garbage is moved away from sight, most people forget about it. Garbage literally becomes “out of sight, out of mind.” But it does not disappear.
Questions to Consider
- Why should we understand where our garbage goes?
- What are some of the processes involved in disposing of waste?
- Would knowing what happens to our waste decrease what we use and dispose of?
- What are some indirect ways that garbage disposal affects people and our environment on a global scale?
- Do we have a responsibility to know if our garbage is affecting the lives of others?
In other activities, we’ve examined some of the costs associated with waste management. Next, we will consider broader impacts of where our garbage goes, and how some is processed for disposal.
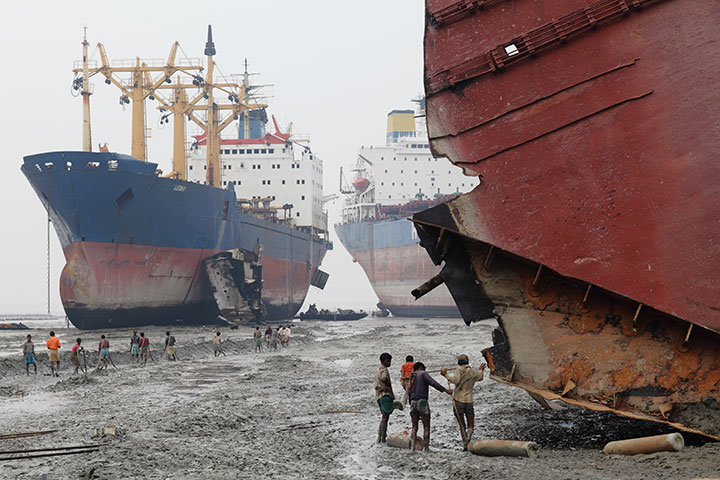
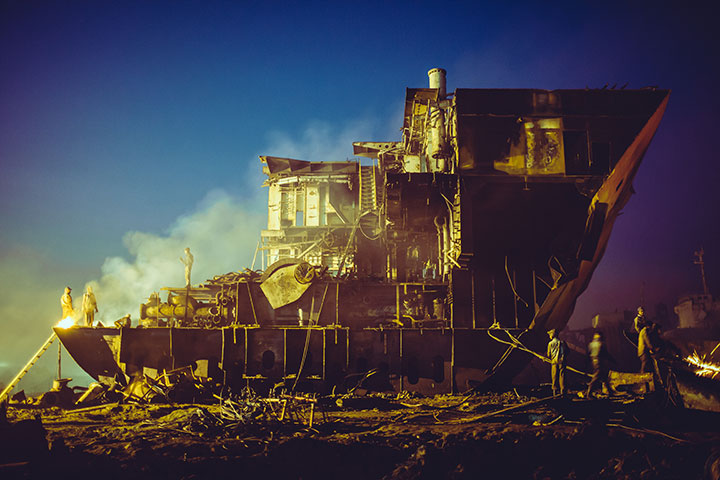
Tell students that one example of processing garbage is called “ship breaking.” After large freight ships start to wear out and require expensive repairs, it is cheaper to break them down and recycle the parts of the ships. This is often done in developing countries that do not have regulations that monitor pollution. In the town of Chittagong, Bangladesh, workers will tear apart a ship and recycle the metal and various components. This is very hazardous work because of the physical demands, but also because of the exposure to toxic chemicals and waste, such as the effects of asbestos and lead from this processing.

#4047
Photographer: Pierre Torset
Source: Pierre Torset Photographie
Communities form around the beaches where these ships are cut up and separated. Read the following quotation from National Geographic about shipbreaking:
Oceangoing vessels are not meant to be taken apart. They’re designed to withstand extreme forces in some of the planet’s most difficult environments, and they’re often constructed with toxic materials, such as asbestos and lead. When ships are scrapped in the developed world, the process is more strictly regulated and expensive, so the bulk of the world’s shipbreaking is done in Bangladesh, India, and Pakistan, where labor is cheap and oversight is minimal.
Industry reforms have come in fits and starts. India now requires more protections for workers and the environment. But in Bangladesh, where 194 ships were dismantled in 2013, the industry remains extremely dirty and dangerous. [3]

#4048
Photographer: Pierre Torset
Source: Pierre Torset Photographie
Have students look over the following photographs and consider the environment around ship breaking. In pairs, have them scan the photographs to answer the following questions:
- How would you describe the working conditions? (Use specifics from the pictures.)
- What hazards are present?
- What are some reasons that people would not want this type of operation near where they live?
- What questions come to mind about fairness or justice? For example, is it fair for large ships to be brought to these locations for demolition? Why or why not? Where might a better location be?
The garbage we produce has many costs. Talk with students about some of the obvious costs, such as it costs money to haul garbage, incinerate or bury garbage, hire people to recycle materials, etc. If the conversation does not head in this direction, begin to ask students about costs that are not monetary or less-obvious, such as costs to the environment from transporting and burning garbage, pollution to ground/drinking water, exposure to toxic materials, smells from decomposing garbage, etc.
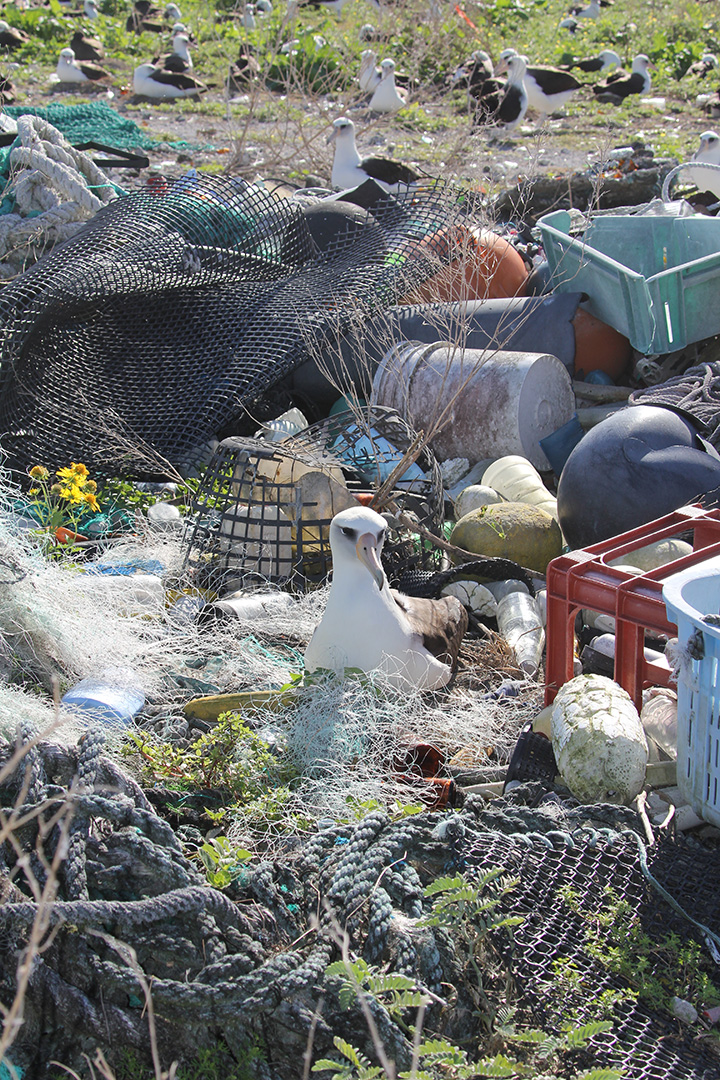
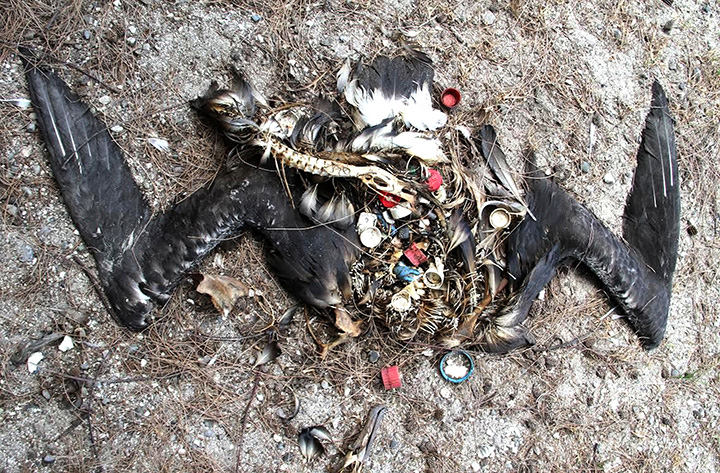
After students have considered some of these costs associated with garbage, mention that many other costs exist. For example, you could show the following two images of birds in the Pacific Ocean, along with the photographer’s caption for the pictures.
Invite the students to find the Midway Atoll on a map or online, and hypothesize where the garbage ingested by these birds originated. The damage to these birds is another cost associated with the garbage produced by people on the Earth. Have the students generate responses to the following questions:
- List ten different things that you see in the pictures of the bird carcasses.
- What do you know about the garbage “patches” or “vortex” in the Pacific Ocean?
- What questions come to mind when you look at the pictures or think about ocean garbage patches?
After they generate answers to these questions, provide students with the opportunity to inquire online about the questions they generated. They can then share with each other the questions they had and the answers they found.
The end of this activity is simply to ask the students “so what now?” After they have considered the idea of “not in my backyard,” where the garbage they produce goes, why communities form around garbage, and the hidden costs of garbage, have them consider what they might do to help raise awareness of the impact of garbage on humans and the environment.
Questions to Consider
The following questions will help guide the conclusion of this activity:
- Should people be aware of where their garbage goes? Why or why not?
- How can you help raise awareness of the monetary and non-monetary costs associated with garbage?
- How does garbage impact communities, people, and the environment?
Extension Activities
- Writing activity: Choose a method of handling waste (landfill, incineration, recycling, etc.). Research the advantages and disadvantages, and write persuasively about the method, comparing it to at least one other method.
Optional: Find photos from print or online sources or take photos that enhance the report. Be sure to include photo attributions.Optional: Make a two-column chart that graphically displays the advantages and disadvantages. - Laboratory activity: At the beginning of the school year, choose a few garbage items (food, plastic, biodegradable plastic). Photograph the items. Predict (hypothesize) whether noticeable degradation will happen over the school year: what will degradation looks like, how you will measure it, what factors affect degradation. If you have a measure of degradation (size, weight, etc.), conduct and record measurements. Put portions of the items in different environments: air, water, and soil. Throughout the year, take photographs, and label them with measurements and written observations. Then compare them to photos and measurements from the beginning of the experiment. At the end of the year, discuss whether predictions were accurate and why or why not. Adjust the initial hypotheses based on the observations over the year.
- Cross-disciplinary writing activity: Read William Rathje’s book Rubbish! The Archaeology of Garbage, selected chapters, or the summary. (See links in References and Further Reading.) Ask a social sciences teacher who knows about archaeology to suggest reading material about an ancient garbage dump that archaeologists used to learn about a civilization that no longer exists. Write a paper comparing and contrasting what modern archeologists have learned from studying landfills in the last few decades, with what archeologists have learned about ancient civilizations.
- Cross-disciplinary activity: Work with an art teacher and a science teacher to develop an art project using material that would otherwise be discarded. If you don’t have an idea already, look at the work of artists who use trash, garbage, or repurposed materials in their work for ideas (see Reusing Garbage: Art Projects in References and Further Reading). Caution: Don’t try to copy artists; instead use the work for inspiration, but have students come up with their own idea
- Cross-disciplinary activity: Work with a science teacher, and a social sciences teacher who knows about business, commerce, and marketing. Develop a product using material that would otherwise be discarded. How much would each item cost to make and market? How much would you need to charge to make an acceptable profit? Examine the work of people who repurpose materials in their work for ideas. Encourage creativity using other peoples’ work as inspiration (without copying).
- Optional activity: Have students take photographs of rubbish from the classroom or the school trash bins and conduct the same counting exercise. Discuss how the school’s garbage might be similar and different from the city, the United States, and other countries. See the NatureBridge “My Garbology” project in References and Further Reading for more details and potential activities.