


Essential Lens: Analyzing Photographs Across the Curriculum
Earth, Climate, and Change: Observing Human Impact
Introduction

#3552
Climate change means the unusually rapid warming of the atmosphere and its scientifically documented effects around the world. The warming is measurable: although annual local weather patterns vary, the average global temperature has increased by nearly 0.8ºC (1.5º F) in the last 100 years. This might not sound like much, but even small temperature changes occurring worldwide have a noticeable effect on the climate, which affects habitats for all organisms, including humans. In addition, the pace of change is increasing: most of the rise in average global temperature has occurred in the last few decades.
Climate change and the human contribution to this change is sometimes denied or depicted as an uncertainty. However, according to the American Association for the Advancement of Science (see References and Further Reading), climate change is not controversial: 97 percent of climate scientists are certain that human-caused climate change is occurring. Climate research is continuing, with scientists and engineers working to predict the consequences of climate change and finding ways to overcome its negative impact.

#3522
People around the world, in cities and in rural areas, are experiencing more extreme temperatures, stronger storms, and loss of land from rising sea levels. Some of the most dramatic effects of climate change are related to water: either too much water that results in flooding or too little that results in droughts and wildfires.
For example, even slightly increased temperatures that result from climate change will melt sea ice. Both melting sea ice and higher temperatures increase the volume of the ocean. Greater ocean volume means higher levels of water along coastal areas, which adds to erosion of these areas. In addition, melting sea ice can lead to global changes in water circulation: water from the melted ice forms a layer at the sea surface that is less dense than the underlying water because it is less salty, potentially preventing the patterns of deep ocean currents from rising to the surface. Melting sea ice also speeds up the warming of the Arctic because water absorbs 80 percent of sunlight, which is about the amount of sunlight that a cover of sea ice reflects.

#3570
In this collection, students will use photographs as data to observe and identify changes over time in water-related features such as coastlines or glaciers. They will use photographs to prompt discussions on the consequences of climate change to humans and habitats. They might even use photographs as motivation to explore how they can be citizen scientists and engineers in studying climate change and mitigating its negative effects in their own communities.
Note: The term “weather” refers to short-term atmospheric features such as precipitation, wind, and temperature. “Climate” means the long-term weather patterns of an area; for example, average temperatures over many years.
Older references might use the term “global warming” to refer to climate change. Global warming refers to the heating effect of greenhouse gases accumulating in the atmosphere. Scientists study more than just how temperature is affected by human activity, however. To emphasize that human activity does more than just influence temperature, the more common term for rising average global temperatures and its effect is “climate change.”
Curriculum Snapshot
- Using photographs and satellite imagery to identify and observe changes in the Earth’s features over time that indicate climate change
- Using photographs and satellite imagery to prompt discussions on the relationship between the water cycle, weather, and climate, especially the contribution of oceans
Key Learning Targets
Students will:
- Observe how living organisms alter Earth’s processes and structures over time.
- Consider how human activity changes the atmosphere, hydrosphere, and biosphere over time.
- Discuss the interactions between processes on the Earth’s surface and human activities.
Essential Questions
These big ideas or essential questions organize the content and topics.
- What evidence have scientists found about the impact of climate change?
- How do the movements of water affect the Earth and its systems?
Prerequisite Knowledge
Before doing these activities, especially the third activity (Where Does the Water Go? A Global Journey), students should be familiar with the water cycle.
Activating Students’ Prior Knowledge
Middle & High School
Earth and Space Science, Environmental Studies, Physical Science, Social Studies

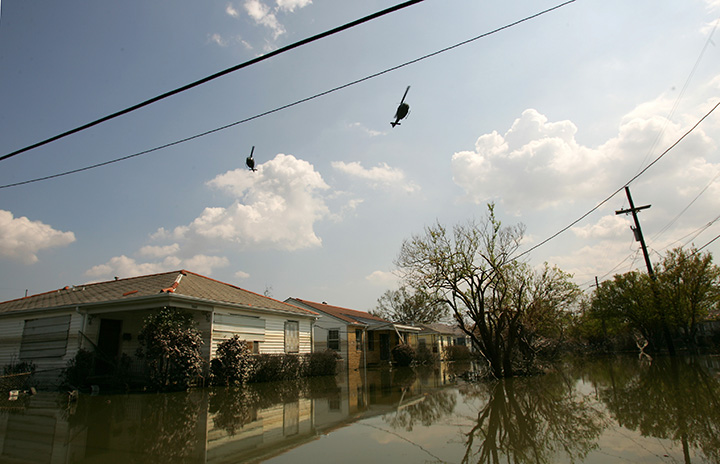
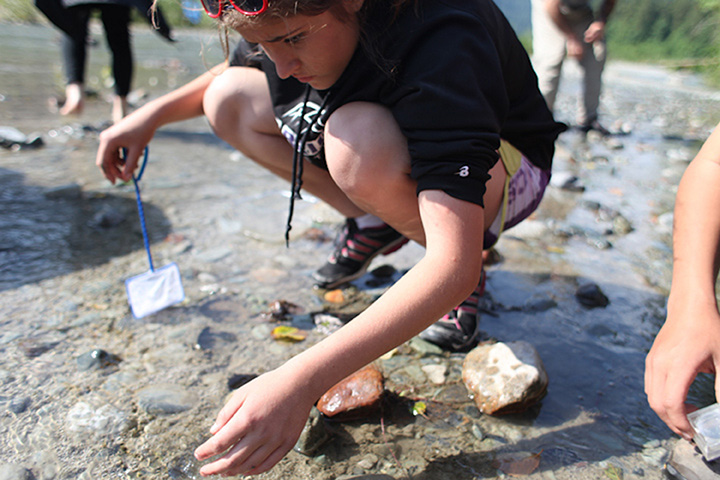
#3506
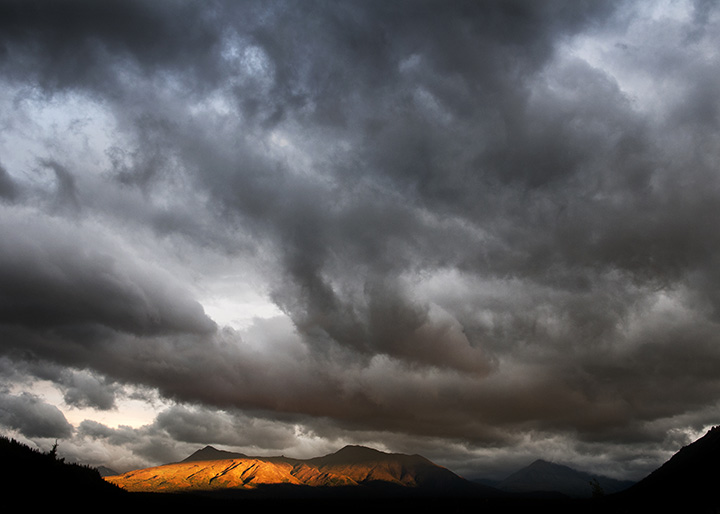
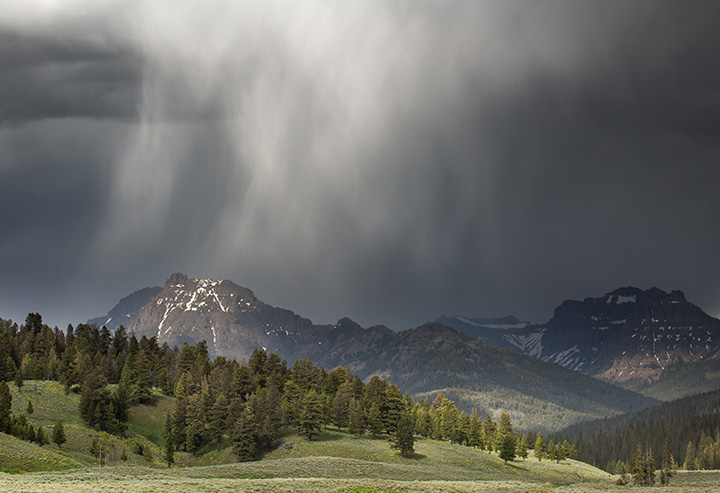
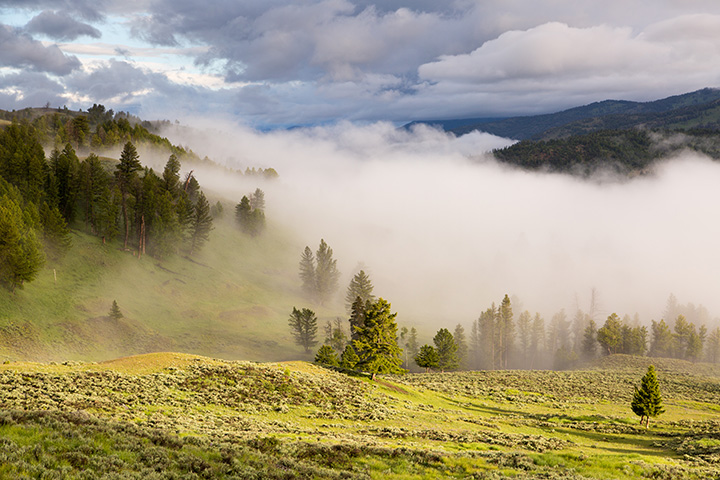
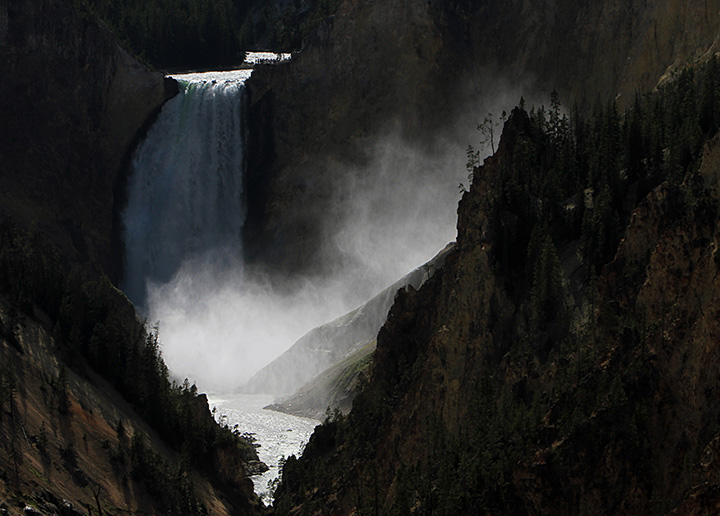
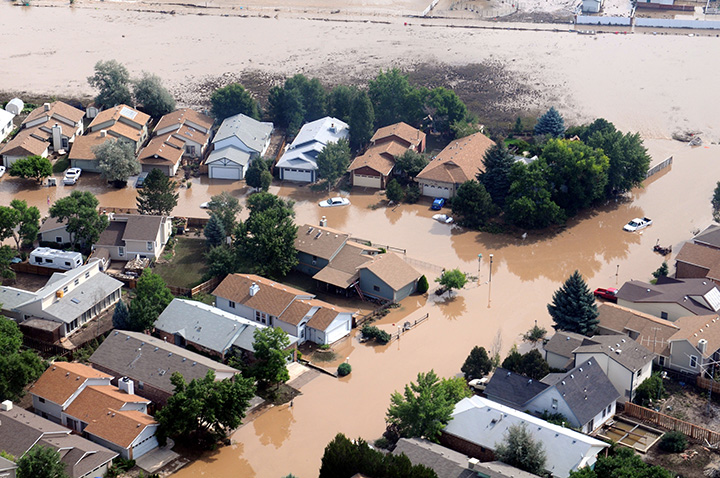
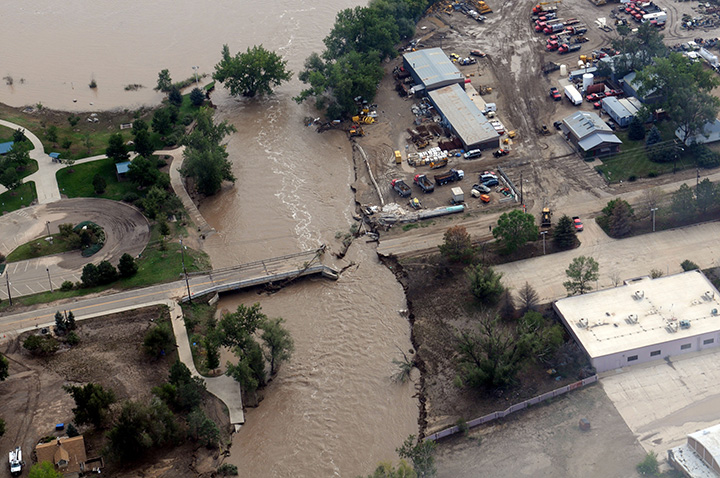
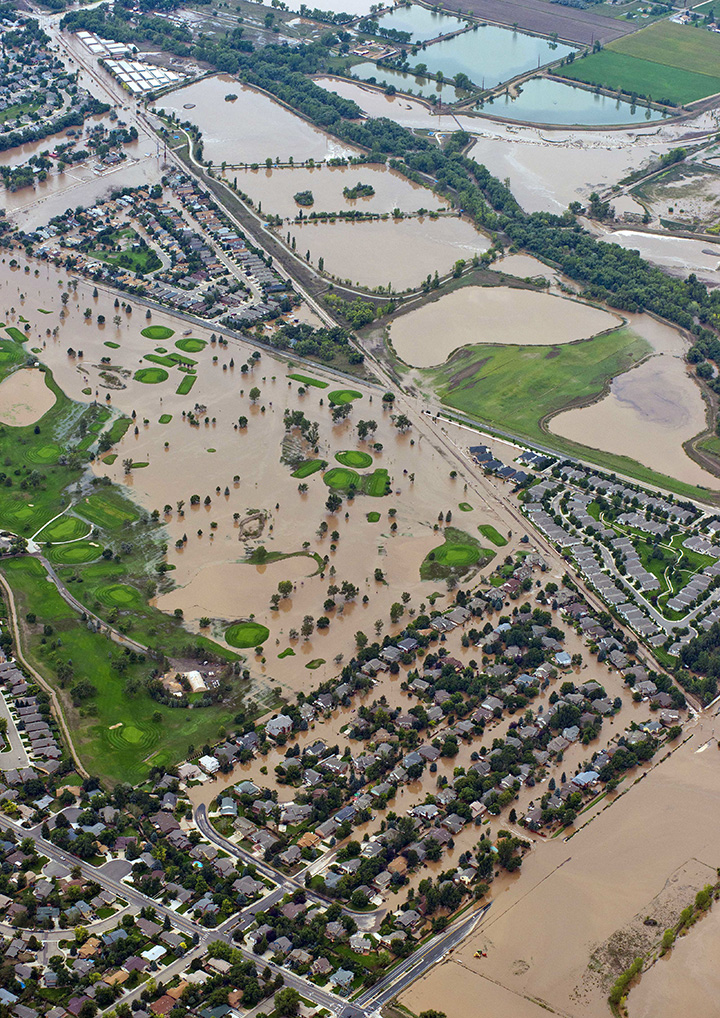
In pairs or small groups, give students one or more of the photographs. Ask students to first talk about their overall impressions of the image, what they see, and what they think the image is of and/or trying to portray. Then have the groups write their observations about evidence they see of effects on habitats, signs of human activity, or the impact of humans.
(Students might or might not see any or all of these features in their photographs. For example, although they can’t see the dam in 3506, they can figure out where it is, hypothesize that the dramatic change in the water is the result of human activity, and brainstorm about its effects on habitats. Although they can’t see how climate change increases coastal erosion, they can begin to hypothesize about its impact on habitats, including for humans.)
In groups or as a class, discuss how any activity or impacts they see might be affecting or have affected communities of organisms, including humans. Emphasize that at this point, no questions or ideas are considered right or wrong.
Note: Frequently asked questions by students about sea level are: What causes sea levels to rise? What is the impact? Changes in sea level can be caused by several factors:
- Exchange of water stored on land in glaciers and ice sheets with ocean water
- Water expansion as the ocean warms
- Storm surges affected by alterations in surface and deep ocean circulation
- Changes in terrestrial water storage, such as extraction of groundwater, building of reservoirs, and runoff
- Subsidence (caving or sinking of land) in river delta regions, land movements, and tectonic displacements
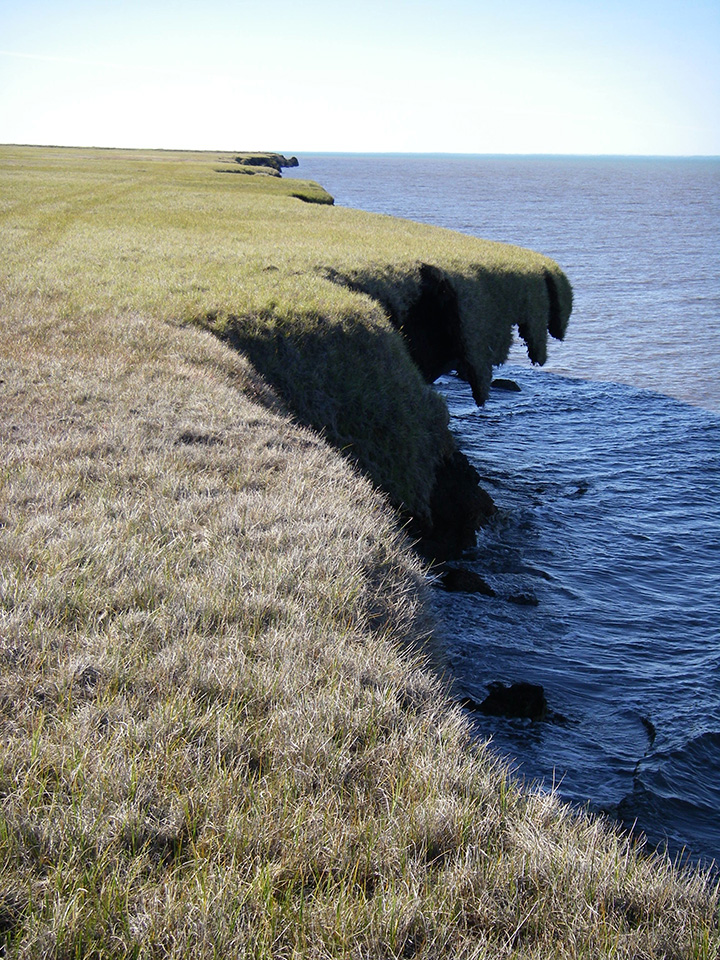
Impacts of rising sea level include shoreline erosion, effects on wetlands and coral reefs, and loss of habitats and land near coasts or rising rivers and streams.

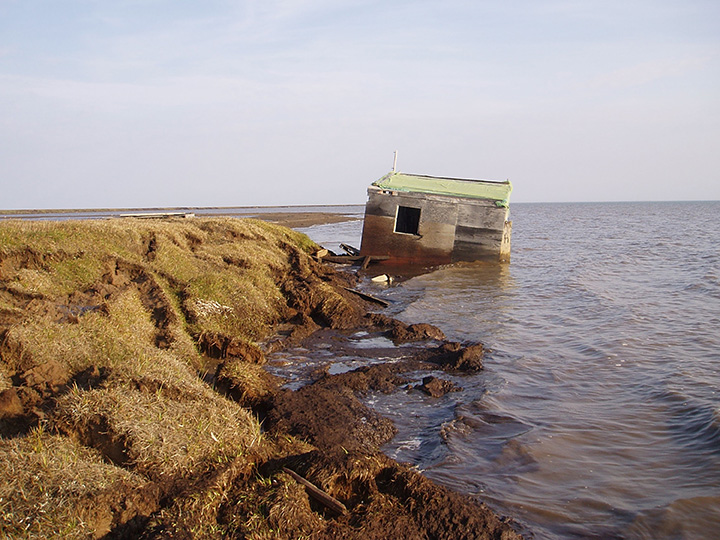
#3505
Note: Students might ask about permafrost. Permafrost is soil that is permanently frozen. When the permafrost melts, the soil is more susceptible to erosion. (In addition, permafrost stores carbon. When the ice melts, the stored carbon is released as greenhouse gases such as carbon dioxide, which further contributes to climate change.)
The term hurricane is used for high wind, cyclonic storms in the Atlantic and Northeast Pacific. The same storm is a typhoon in the Northwest (Asian) Pacific, and a cyclone in the South Pacific and Indian Ocean. Monsoon is the term for a seasonal wind in Southeast Asia. Some monsoons bring heavy rain.
Also, see the Habitable Planet resources, which have potential discussion topics and common student misconceptions, such as the possibility of a technological fix or the impossibility of human extinction.
What Is the Evidence?
Middle & High School
Earth and Space Science, Environmental Studies, Physical Science, Social Studies
Background
Weather changes and overall climate can vary between warm and cool periods; however, average global temperatures have unquestionably risen in the last 100 years. Photographs can record how the effects of small changes in temperature will, over time, result in dramatic changes in oceans, coastlines, and other habitats. Photographs are essential for recording these changes because they might occur slowly, with variation over months or years that obscures a definite overall trend. For example, because coral reefs grow slowly, changes to their structure or composition are difficult to observe day to day. The same slow alterations occur to polar caps, glaciers, and sea level. Over time, however, these small changes add up to a noticeable difference. In this activity, students will use photos taken of a single location at different times to look for evidence of climate change.
LEARNING TARGETS
- I can use photographs to observe changes over time and make inferences on the effects of these changes.
- I can ask questions about the evidence of change that is altering the global climate.

#3518 Drought Conditions in California
Climate scientists have overwhelming evidence that human activities are affecting our climate, mainly through increased production of greenhouse gases such as methane and carbon dioxide (CH4 and CO2). Many sources generate these gases, including normal metabolism. Humans exhale CO2, and several types of bacteria generate CH4. Burning fossil fuels also generates greenhouse gases, however, and our use of petroleum-based fuels and the amount of greenhouse gases in the atmosphere have increased dramatically since the nineteenth century. Greenhouse gases re-radiate heat, raising atmospheric temperatures. Higher temperatures increase the amount of water that evaporates from oceans into the air. This affects land conditions as precipitation patterns change, potentially leading to floods or droughts.
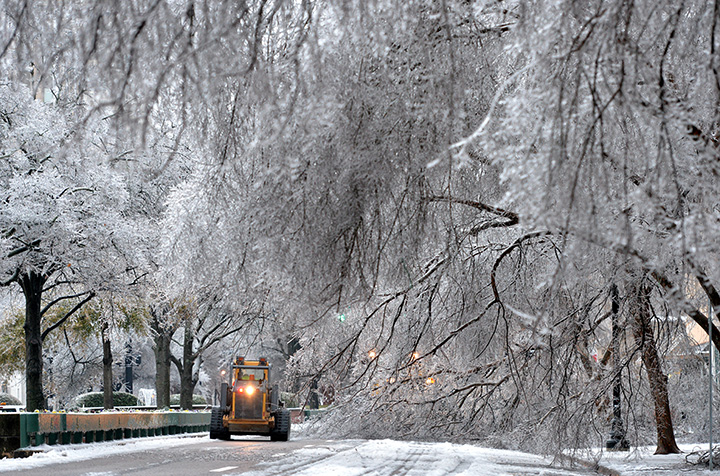
Although we sometimes think of climate change as affecting only summer temperatures, in many ecosystems, warming winters also severely affect plants, animals, and humans. For example, increased atmospheric moisture makes snowstorms more severe. A lack of freezing days can cause infestations of insects that would normally be killed by freezing temperatures.
Another consequence of climate change is rising sea levels because of several factors, including higher water temperatures, and increased volume as water that is trapped as ice sheets and glaciers melts. When sea levels are higher, islands and coastal regions are more seriously affected by storm surges and, on an everyday basis, by encroaching salt water that changes habitats. Plants, animals, and microorganisms that are adapted to particular environmental conditions must adapt or change habitats to survive. Changing habitats affect conditions for humans, such as our supply of food and water.
Begin the Activity
Materials:
- Paper
- Pencils or pens
In pairs or small groups, give students a series of photographs of the same location taken at different times. Have students observe, and then list and describe all the features in each photograph. Have them pay particular attention to anything that changed or anything that is exactly the same in the photos.

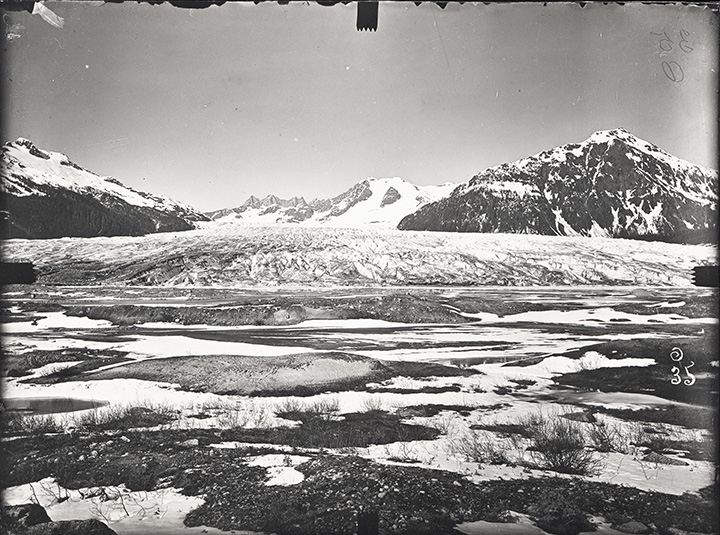
#3503 Muir Glacier and Muir Inlet, 1980

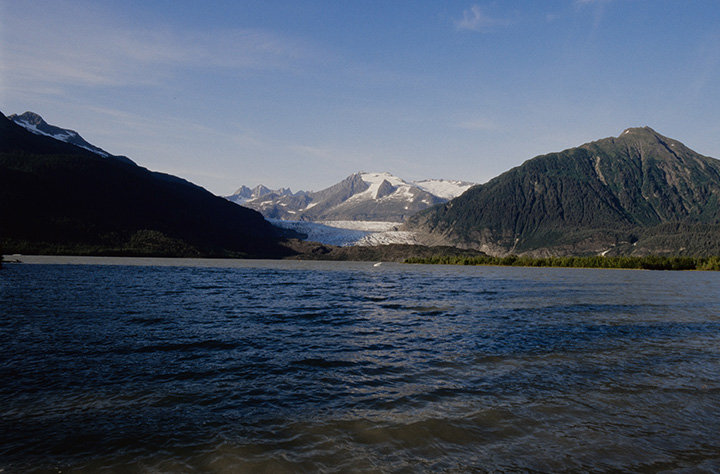
#3504 Muir Glacier and Muir Inlet, 2003
Once they have generated a list, have the students mark the list for items that changed and items that did not change in the photo series. Have the students use the list to draw a Venn diagram. One circle will list items in the earlier photo, with their descriptions, that look different from items in the later photo. The other circle will list items in the later photo, with descriptions, that look different from the earlier photo. The intersection will list items that appear the same in both photos. (So the nonintersecting parts might list the same items—such as a mountain or a rock—but will have different descriptions for those items, such as snow-covered or bare. The intersecting part will have items that have the same descriptions for both photos, such as a rocky ridge with a little snow.)
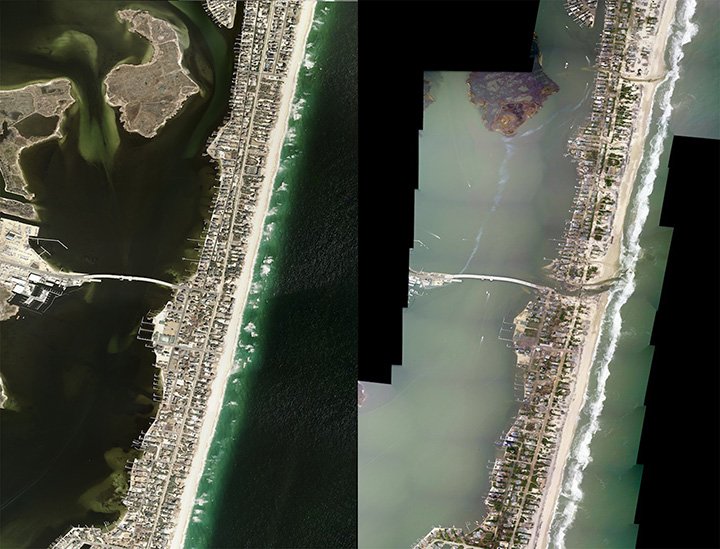
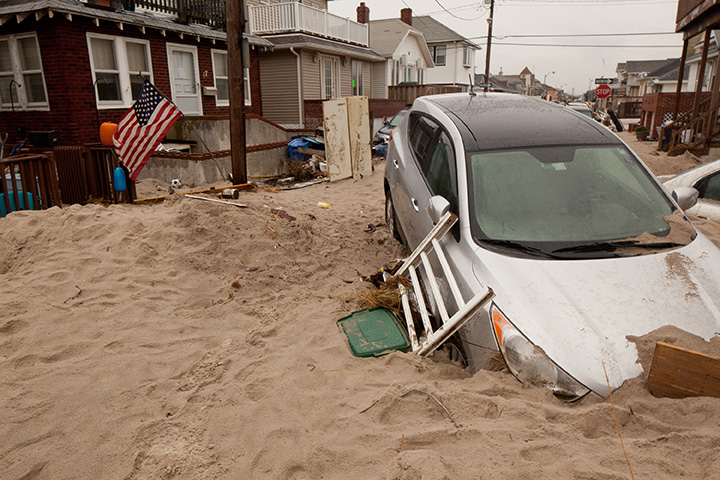
Optional, advanced, or group discussion example: Photo 3516 show photos before and after Hurricane Sandy, a particularly strong hurricane in 2012. Although an individual hurricane might seem like an isolated event, increased atmospheric moisture can make storms more severe.
When all the teams are finished, have them share their results with the class. Ask guiding questions and bring up discussion questions about key points in each set.
Questions to Consider
- What might be the impact of these changes beyond what is in the photo?
- What changes might be disruptive for wildlife habitats, vegetation, or human communities?
- What ways can you think of to reduce the disruptive effects of the changes you observed?
- Suggested activity for this question: Have students make a two-column table with pros and cons of trying to reduce a disruptive effect of climate change. For example, if students think of building a dam to prevent floods, a good exercise might be writing down the upstream effects of a dam.
- Optional question if your class has covered material on Earth’s Systems (ES22): What might be the scientific basis for any changes your team noted in the earlier and later photographs?
Students’ answers will vary depending on the set of photos they received. Their answers should reflect the changes they have already noticed and what will happen if those changes continue.
For example, if they noticed that the amount of water in an area has increased over time, they might say that the area is likely to continue flooding, and people who live in the area will have to move.
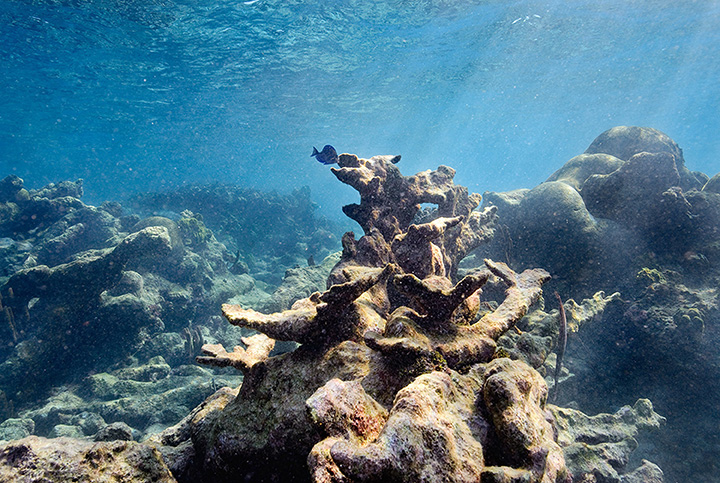
They might note that coral reef death affects species that depend on coral habitats. (Coral bleaching, which is loss of the algae that live in coral tissues, occurs when water is too warm and can lead to death of the coral.)

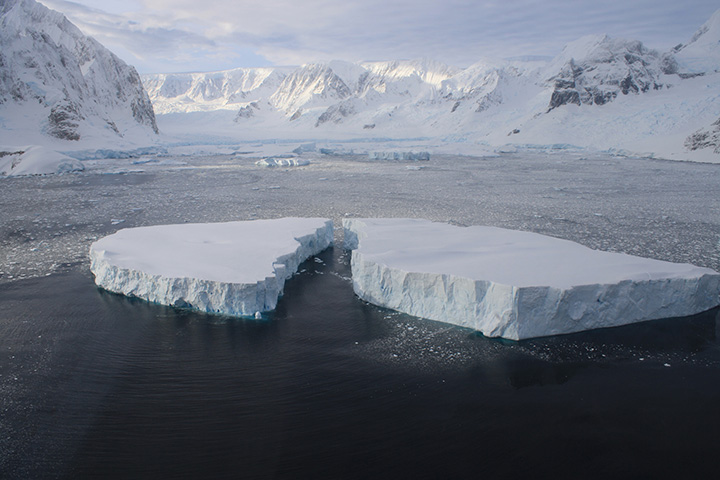
#3572

#3573
They might note that flooding could continue if warmer temperatures result in increased water evaporation, leading to the heavy rainfall that causes flooding. In contrast, increased evaporation in places that are normally dry results in droughts. Other impacts include heat waves; warmer winters; changing ecosystems; a possible loss, decrease, or increase in species; and effects on agriculture from drought, heat, and floods.
Anything that causes changes in the ecosystem is likely to be disruptive to wildlife. For example, flooding will disrupt a habitat for any wildlife living in the flooded area. Students might note that, although humans often have the technology to help them live in changing conditions, severe changes, such as extreme flooding or drought, might cause people to move from a community.
Where Does the Water Go? A Global Journey
Middle & High School
Earth and Space Science, Environmental Studies, Physical Science, Social Studies
Background
This activity should be done after the class has learned about the water cycle. Consider reviewing the essential features of the cycle before starting this activity.
Water is three-fourths of the Earth’s surface. Most of that water (97%) is in oceans, so changes in our oceans also have profound effects on the atmosphere and conditions on land. As students learned in the class, water is solid (ice), liquid (water), or gas (vapor), moving between these states and around the planet. Sunlight melts ice and evaporates water, creating atmospheric water vapor, which condenses into rain or snow. Gravity causes the water to fall to Earth, where it returns to oceans, lakes, and rivers.
LEARNING TARGETS
- I can describe the cycling of water through Earth’s systems.
- I can interpret and explain how the complex interactions of air and water movements results in changes in local weather.
Begin the Activity
Materials:
- Sticky notes
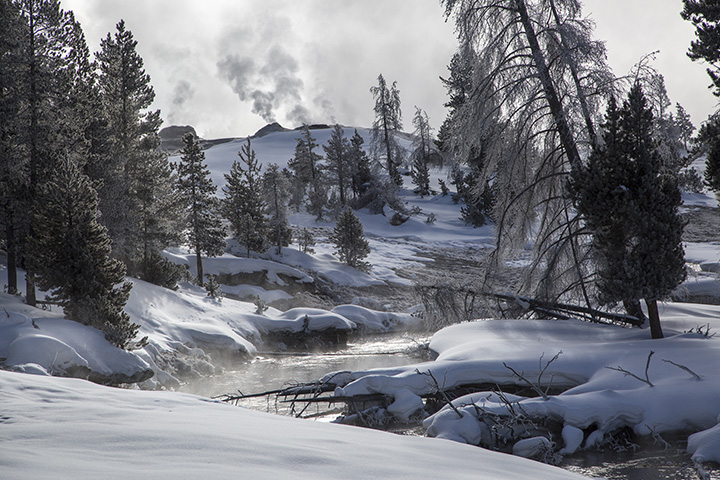
Students might have noticed that many of the consequences of climate change that they have been observing in the photo collection are related to water. Increased atmospheric moisture leads to stronger storms and flooding, for example. Ask students what percent of the Earth’s water they think is in oceans (97%). Ask them to identify other locations of water (including ice) on Earth and in the Earth’s atmosphere.

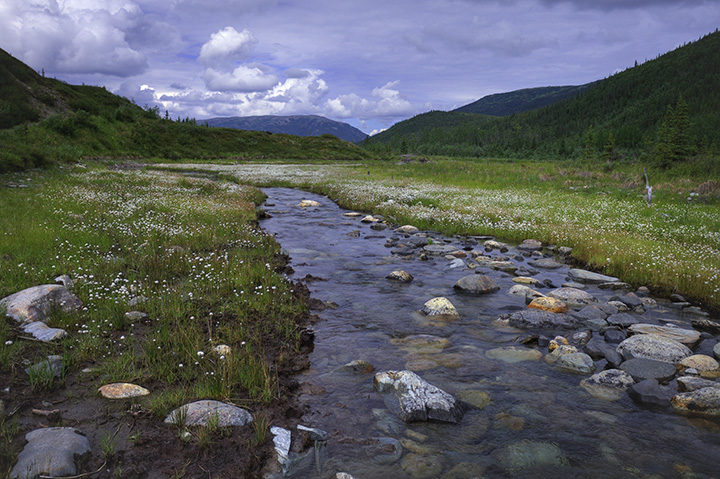
#3537
After reviewing the locations of water, have students work in small groups or pairs to re-create the water cycle by using the provided photos. As they arrange photos on their desks, have them explain the different water states (ice, liquid, and vapor), how water might travel between locations while in the different states, and the factors—such as sunlight or air temperature—that might cause water to be converted to one state or another. (Optional: have them refer to a diagram of the water cycle from their textbook or other source.)
Ask students to reflect and comment on connections between the states of water and its global locations. Have them discuss the likely consequences of climate change on each step, each component, and the entire system. To keep track of their ideas, they might add sticky notes to each picture, predicting the effects of climate change on this part of the water cycle.
Questions to Consider

#3549
- What ideas did your group come up with about the possible effects of climate change on the water cycle? Share your results with other groups. How do your ideas compare to the ideas of other groups?
- Overall, how would you describe the effects that climate change might have on the water cycle, especially if current trends continue?
- What are the impacts that water and changes in water level can have on the surface of the earth?
- How did photographs help organize ideas about climate change and the water cycle?
- Optional/advanced: If you have studied other cycles that occur on the earth (e.g., carbon cycle), do you think that they would also be affected by climate change? If climate change continues with recent trends, what might happen on the surface of the Earth?
Students might predict acceleration or intensification of parts of the cycle; for example, they might predict increased evaporation with increased temperature. They might predict stronger rain and snowstorms after the increased evaporation.
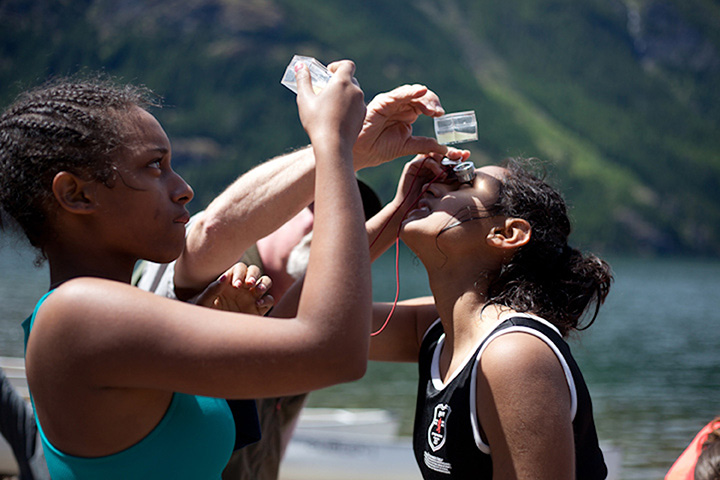
Citizen Science
Middle & High School
Earth and Space Science, Environmental Studies, Physical Science, Social Studies
Background
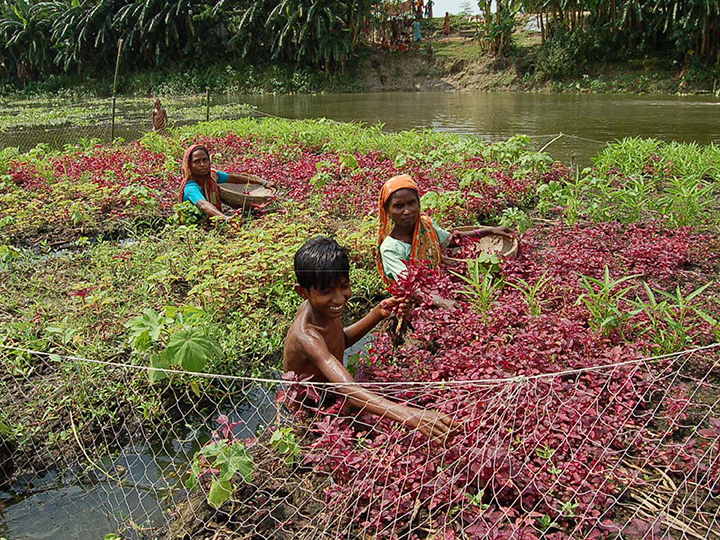
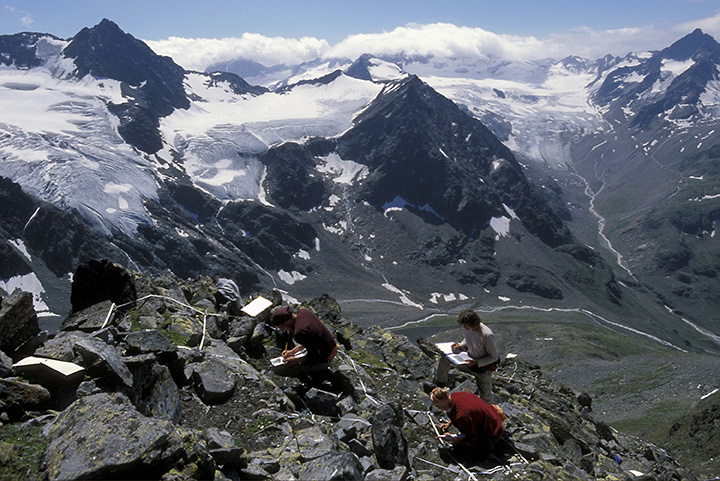
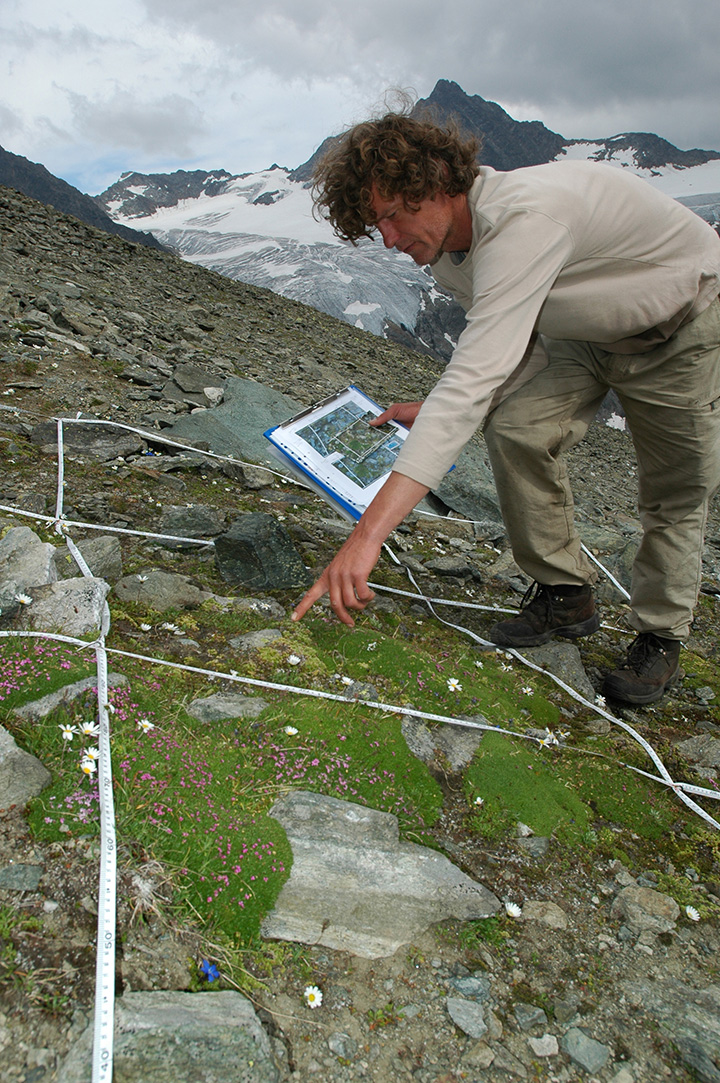
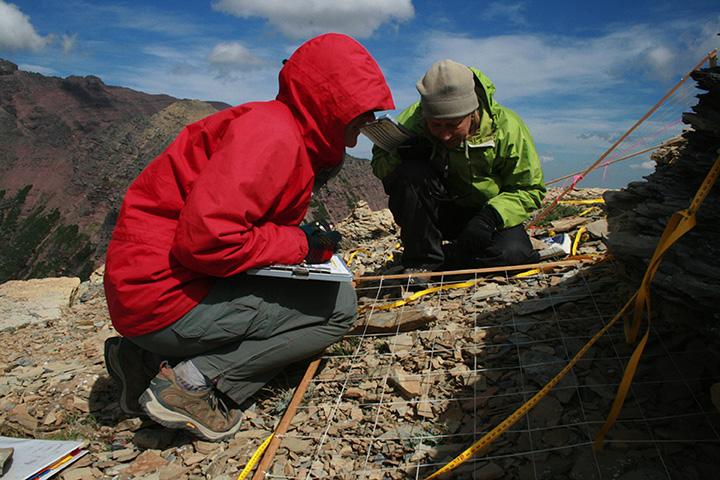
Scientists and the public are noticing more extreme weather of all types, such as stronger winter storms, earlier springs, and warmer summers. These observations give students opportunities to design or contribute to public science projects. For example, temperatures, storm frequencies, and rain and snowfall can all be measured. Your school might even be involved in recording local meteorological data. Long-term weather data for your area might be available at local or national websites. Climate change affects habitats, which influences the plants and animals in an area and the timing of their seasonal appearances. Conservation societies often organize volunteers to keep records of local flora and fauna; for example in annual bird and fish counts or plant surveys. Teachers, students at your school, or their families might be involved in these efforts. Other examples of ways that students might participate in public science projects are in the photos.
In this activity, students will use photographs as prompts to discuss what they are or could be doing to apply what they have learned in this collection to observe or address climate change in their community.
LEARNING TARGETS
- I can apply scientific principles to evaluating methods for monitoring and minimizing human impact on my local environment.
Begin the Activity

#3571
Give students photos of climate scientists and student-citizen scientists at work. Use the photos as prompts for discussions about what problems climate change is creating around the world, either issues students have heard of or effects they would predict based on what they have learned about climate change, the water cycle, weather, and climate. Have students discuss possible studies and research projects they might conduct locally.
Question to Consider
- What are some actions an ordinary citizen scientist can take to counteract the negative impact of climate-change-related local weather patterns? Choose a possible action and discuss whether a community affected by climate change should take this action. If so, what might some consequences be? If not, why not?
Standards
The content is in accordance with the Next Generation Science Standards (NGSS), specifically:
ESS2, Earth’s Systems
- The Roles of Water in Earth’s Surface Processes (water cycle, relationship between patterns of water movement in the atmosphere and local weather patterns)
- Weather and Climate (influence of interactions between the geosphere, hydrosphere, atmosphere, and biosphere; major influence of ocean on weather and climate)
- Biogeology (feedback between the biosphere and other Earth systems)
ESS3, Earth and Human Activity
- Human Impacts on Earth Systems (damage or destruction of natural habitats)
- Global Climate Change (factors affecting the rise of Earth’s mean surface temperature and the impact on climate)
The content also addresses climate, earth science, and atmospheric literacy principles, which are considered essential information by the Earth and Space Sciences community. (See the Framework for Science Education in “References and Further Reading.”)
Extension Activities
- Explore current extreme weather events around the globe. Check news sources to find examples of extreme weather events. Find news stories with photos and examine the photos, using the questions from the activities in this collection. An additional option is to write an essay in a style your class has been learning (such as persuasive) based on one or more news stories and the accompanying photos.
- Join the U.S. Geological Survey’s iCoast project, and analyze coastline photographs before and after a major storm. Human eyes are better than computers at noting changes in complex coastline features, so the U.S. Geological Survey needs your help.
http://coastal.er.usgs.gov/icoast/index.php
References and Further Readings
Web
Framework for Science Education
A Framework for K-12 Science Education. Practices, Crosscutting Concepts, and Core Ideas
http://www.nap.edu/catalog.php?record_id=13165
Graph from the California Department of Water Resources
http://cdec.water.ca.gov/cdecapp/resapp/getResGraphsMain.action
The Habitable Planet
http://www.learner.org/courses/envsci/unit/text.php?unit=12&secNum=0
“Water: Our Thirsty World.” National Geographic Magazine.
http://ngm.nationalgeographic.com/2010/04/table-of-contents/
Gary Braasch website
http://www.worldviewofglobalwarming.org
Facing the Future
https://www.facingthefuture.org
American Association for the Advancement of Science (AAAS)
http://whatweknow.aaas.org/
NASA maps and climate change
http://earthobservatory.nasa.gov/Features/WorldOfChange/decadaltemp.php
http://www.nasa.gov/mission_pages/noaa-n/climate/climate_weather.html
USGS Image gallery
http://gallery.usgs.gov/collections/Climate_Change
Erosion in Alaska
http://www.usgs.gov/newsroom/article.asp?ID=2141#.U5zXh41dVe5
Journey North
https://www.learner.org/jnorth/
GLOBE
www.globe.gov
Project Budburst
http://budburst.org
Cornell Laboratory of Ornithology
http://www.birds.cornell.edu
University Corporation for Atmospheric Research (UCAR) LEARN Project
http://www.ucar.edu/learn
Intergovernmental Panel on Climate Change
http://www.ipcc.ch
United Nations Educational, Scientific and Cultural Organization (UNESCO)
http://www.unesco.org/new/en/education/themes/leading-the-international-agenda/education-for-sustainable-development
Education for Sustainable Development Tookit
http://www.esdtoolkit.org
National Oceanic and Atmospheric Administration Climate Literacy
http://cpo.noaa.gov/OutreachandEducation/ClimateLiteracy.aspx
Loren Eiseley, Anthropologist and Author
www.eiseley.org
American Geophysical Union
http://virtualoptions.agu.org
Permafrost
http://www.wunderground.com/resources/climate/melting_permafrost.asp
California Drought Article
http://www.nbclosangeles.com/news/local/Water-CA-California-Drought-Friant-Dam-San-Joaquin-Delta-259219481.html
Books
Braasch, Gary. Earth under Fire: How Global Warming Is Changing the World. Berkeley and Los Angeles: University of California Press, 2007.
http://www.earthunderfire.com
Cherry, Lynne and Gary Braasch. How We Know What We Know About Our Changing Climate: Scientists and Kids Explore Global Warming. Nevada City, CA: Dawn Publications, 2008.
http://www.lynnecherry.com/how_we_know_what_we_know_about_our_changing_climate__scientists_and_kids_explore_67915.htm
National Science Teachers Association Press. Global Climate Change: Resources for Environmental Literacy. NSTA Press Book. 2007.
http://www.nsta.org/store/product_detail.aspx?id=10.2505/9781933531182
Fleck, John. The Tree Rings’ Tale: Understanding Our Changing Climate. Albuquerque, NM: University of New Mexico Press, 2009.
http://www.unmpress.com/books.php?ID=11781365963614
Film and Video
Chasing Ice
http://www.chasingice.com
“California’s Extreme Drought, Explained.” New York Times video. July 5, 2014.
http://www.nytimes.com/video/us/100000002980095/californias-extreme-drought-explained.html?action=click&pgtype=Homepage&module=video-player-region®ion=video-player-region&WT.nav=video-player-region
Additional Photographic Collections
NASA: Images of Change
http://climate.nasa.gov/state_of_flux#Drought_California_930x308.jpg
Thomas Lovejoy
http://www.nationalgeographic.com/explorers/bios/thomas-lovejoy/
The Shrinking Aral Sea and related student activities
http://www.columbia.edu/~tmt2120/introduction.htm
Annenberg Learner: Teaching Geography
http://www.learner.org/workshops/geography/pdf/1aralsea.pdf
NASA: Earth Observatory
http://earthobservatory.nasa.gov/IOTD/view.php?id=4463